Category Archives: Lab

Google Cloud Platform Free Tier

Google recently provide the free tier on their Google Cloud Platform (GCP). The free tier will be free forever (but what Google offered are subjected to changes).

Also included in the free tier is $300 credit for 12 months (I think this was 2 months – good !)

I applied, created Google Compute Engine (GCE) f1-micro instance, ran the same benchmarks as I did on Vultr, DO, and Scaleway.

The best results I got from the instance:

dd write bs=4k count=10k  100k  1M
                    1500  39.6  37.5 MB/s
dd read bs=4k 
63.1 MB/s
sysbench --test=cpu --cpu-max-prime=10000 run
11.7567 sec.
stress-ng --cpu 1 --cpu-method all -t 30 
156.75 ops/sec
BUT …

The results were not consistent.  I ran the dd write 5 more times, the results varied from 211 MB/s to 1.5 GB/s. sysbench results varied from 11 to 13 sec. stress-ng varied between 50 – 150 ops/sec.

I think this is because almost all the resources for free tier (CPU, disk, network) are shared among others.

It’s free, though.

CPU overloaded by kidle_inject ?

As it’s named, kidle_inject is a process to inject idleness to processors.

On a good day, this will keep idle your processors, lower processor temperature, and save your battery.

On a bad day, it will consume your processor somewhat like 50%+ on all cores, slow down your laptop, and drain your battery.

But, you can control this. Many new Intel-based processors could use intel_pstate driver to manage processor power consumption. If you use intel_pstate, you can drop intel_powerclamp (which would run kidle_inject). help your laptop to consume less power.

Just

# modprobe -r intel_powerclamp

Or, consider to put

blacklist intel_powerclamp

in your /etc/modules (or modprobe)

YMMV.

Intel® Optimized LINPACK Benchmark on Debian and Ubuntu

Got a chance to grab 8 dedicated servers. All of them are identical configuration.

  • Intel Xeon E5-2660 2.20 GHz – 8 Core / 16 Threads
  • 16GB (DDR3) Memory
  • 240GB (SSD) Storage
  • 1 Gbps Network Port

And I put Debian on 2 of them and Ubuntu 2 of them. Since I use these servers for computation, I tested all of them  by running Intel LINPACK Benchmark.

The results:
Ubuntu 16.04.2 / Linux 4.4.0

Size   LDA    Align.  Average  Maximal
1000   1000   4       57.1781  63.1674
2000   2000   4       96.3596  99.1686
5000   5008   4       120.8776 121.0789
10000  10000  4       129.6896 129.7670
15000  15000  4       132.1119 132.1371
18000  18008  4       133.5032 133.6047
20000  20016  4       134.7515 134.7724
22000  22008  4       134.7769 134.8034
25000  25000  4       135.2187 135.2249
26000  26000  4       135.3471 135.3511
27000  27000  4       135.7265 135.7265
30000  30000  1       135.9339 135.9339
35000  35000  1       136.3998 136.3998
40000  40000  1       136.0928 136.0928
45000  45000  1       135.4024 135.4024

Ubuntu 16.10 / Linux 4.8.0

Size   LDA    Align.  Average  Maximal
1000   1000   4       67.6860  75.8030
2000   2000   4       97.1338  98.9928
5000   5008   4       120.8437 120.9400
10000  10000  4       129.5845 129.5925
15000  15000  4       132.0033 132.0423
18000  18008  4       133.5847 133.5954
20000  20016  4       134.7129 134.7186
22000  22008  4       134.7988 134.8389
25000  25000  4       135.1581 135.1615
26000  26000  4       135.2965 135.2966
27000  27000  4       135.7175 135.7175
30000  30000  1       135.8775 135.8775
35000  35000  1       136.3674 136.3674
40000  40000  1       136.0681 136.0681
45000  45000  1       135.6452 135.6452

Debian 8.7 / Linux 3.16.0

Size   LDA    Align.  Average  Maximal
1000   1000   4       57.1597  62.6083
2000   2000   4       87.6385  96.1681
5000   5008   4       115.0042 115.2121
10000  10000  4       120.6037 120.7413
15000  15000  4       126.8568 126.8810
18000  18008  4       128.2295 128.2299
20000  20016  4       128.9295 128.9335
22000  22008  4       129.7550 129.7679
25000  25000  4       130.2622 130.2687
26000  26000  4       130.4710 130.4769
27000  27000  4       130.1460 130.1460
30000  30000  1       131.0764 131.0764
35000  35000  1       131.8341 131.8341
40000  40000  1       131.7159 131.7159
45000  45000  1       131.6021 131.6021

Debian 8.7 / Linux 4.8.0

Size   LDA    Align.  Average  Maximal
1000   1000   4       73.9033  75.2857
2000   2000   4       96.1756  98.1587
5000   5008   4       114.9453 115.1133
10000  10000  4       120.6623 120.6715
15000  15000  4       126.8516 126.8579
18000  18008  4       128.1927 128.1953
20000  20016  4       128.9059 128.9097
22000  22008  4       129.7727 129.8013
25000  25000  4       130.2268 130.2318
26000  26000  4       130.4389 130.4403
27000  27000  4       130.1010 130.1010
30000  30000  1       131.1211 131.1211
35000  35000  1       131.8388 131.8388
40000  40000  1       131.7462 131.7462
45000  45000  1       131.6341 131.6341

Now,  can anyone tell me why Debian is slower ? .. hmm

€2.99/mo. Scaleway VC1S

Same tools, same OS as $5/month: DigitalOcean vs Vultr

dd write bs=4k count=10k  100k  1M
                     403   398  184 MB/s
dd read bs=4k 
2.0 GB/s
sysbench --test=cpu --cpu-max-prime=10000 run
17.9875 sec.
stress-ng --cpu 1 --cpu-method all -t 30
94.22 ops/sec

The disk performance is comparable to those of DO/Vultr. But, even equipped with 2 x 64-bit x86 processor, CPU performance is lower than single core on $5/mo. VPS of DO/Vultr.

Since I use them as a web server, so I run ab -n500 -c500 requesting phpinfo() ..

phpinfo() 
Vultr:    2102.08 req./sec
Scaleway: 1543.10 req./sec

YMMV.

$5/month: DigitalOcean vs Vultr

Tools: dd, sysbench, stress-ng. I know,  you’d say they are NOT benchmark tools. I don’t care, I just need quick tests.

Here we go:

dd write bs=4k count=10k   100k  1M
do:                  350   465   424 MB/s
vultr:               699   538   466 MB/s
dd read bs=4k
do:    475 MB/s
vultr: 2.7 GB/s
sysbench --test=cpu --cpu-max-prime=10000 run
do:    14.2562 sec.
vultr: 13.7561 sec.
stress-ng --cpu 1 --cpu-method all -t 30
do:    154.15 ops/sec
vultr: 186.38 ops/sec

/me .. goes vultr.

do-release-upgrade and PHP7

16.04.1 ออกมาได้ประมาณหนึ่งสัปดาห์ 14.04 ก็เริ่มจะ upgrade กันได้ วันนี้สั่ง do-release-upgrade เรียบร้อยดี

ลง PHP7 เพิ่ม / เอา PHP5 ออก / แก้ไข socket path = เว็บกลับมาปกติ

ง่ายเกินไปนะ :P

ceph

วันนี้ ceph เดี้ยง

สืบพบว่ามาจาก monitor node 2 ใน 3 ตัว ..  ทั้งสองตัว เป็น VM connect ได้ daemon running  แต่ disk ของตัว host เป็น read-only .. พอ monitor พยายามบันทึกข้อมูลลง disk ไม่ได้มันก็ค้าง พอ monitor ค้าง ceph cluster ทั้งก้อนหยุดทำงาน

ได้ใช้ท่า troubleshooting: stop monitor / dump monmap / ลบ monitor node ที่ใช้งานไม่ได้ออกไปจาก monmap / inject monmap ตัวใหม่เข้า monitor node ที่ใช้งานได้

restart monitor

คืนชีพ (^^)v

Graylog Extractor for Fortigate Firewall

I’ve been using Graylog in production for awhile. It’s a great log analysis tool, backed by elasticsearch. Conceptually, graylog is pretty much like splunk. I consolidate approximately 170-200 million log messages to graylog everyday. So, I need to optimize them well enough.

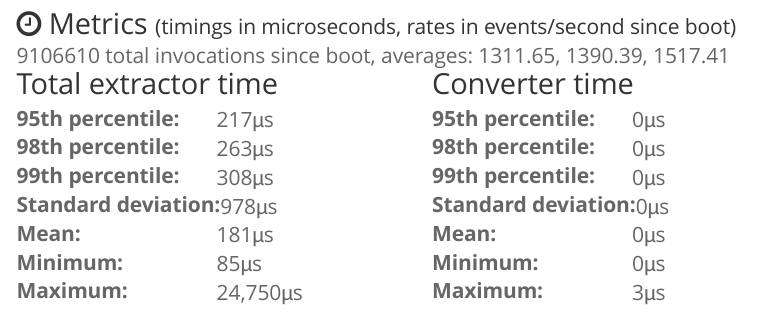
Few days ago, I started to use Fortigate extractors from a git repo. It uses regex, and it is very slow. So I (have to) write my own extractors. I write Grok pattern, and keep rewriting until I could cover all messages I need to extract. Then, I started to optimize the pattern. The result is quite good though. I could reduce extractor time from more than 100,000 usec to about 100 usec.

extractor

Yes, that’s approximately 1000x times faster. It’s definitely not perfect though, but it works for me. If you think it might be good for you, you can download my Fortigate content pack here.

Enjoy :)